Combining Remote Sensing Data and Machine Learning to Predict Crop Yield
Jiaxuan You, Xiaocheng li, melvin low, David B. Lobell, Stefano Ermon
Understanding crop yield is central to sustainable development
Understanding worldwide crop yield is central to addressing food security challenges and reducing the impacts of climate change. It can help achieve zero hunger, which is among the top of UN Sustainable Development Goals for the year of 2030.
In the project, we introduce a scalable, accurate, and inexpensive method to predict crop yield using publicly available remote sensing data and machine learning. Our deep learning approach can predict crop yield with high spatial resolution (county-level) several months before harvest, using only globally available covariates. We believe our solution can potentially help making informed planting decisions, setting appropriate food reserve level, identifying low-yield regions and improving risk management of crop-related derivatives.
what problems are we trying to solve?
To ensure food security, here are some questions people really care about. Say, where shall we send food aid? Or, how much food can we produce this year? To solve the problem, we need to forecast the crop yield (average food production within a region, usually measured in bushel/acre) before harvest in a given year. Specially, we've tested our idea in predicting county-level soybean yield in the United States, and we did quiet well even in months before harvest. Here is the basic workflow of our approach.
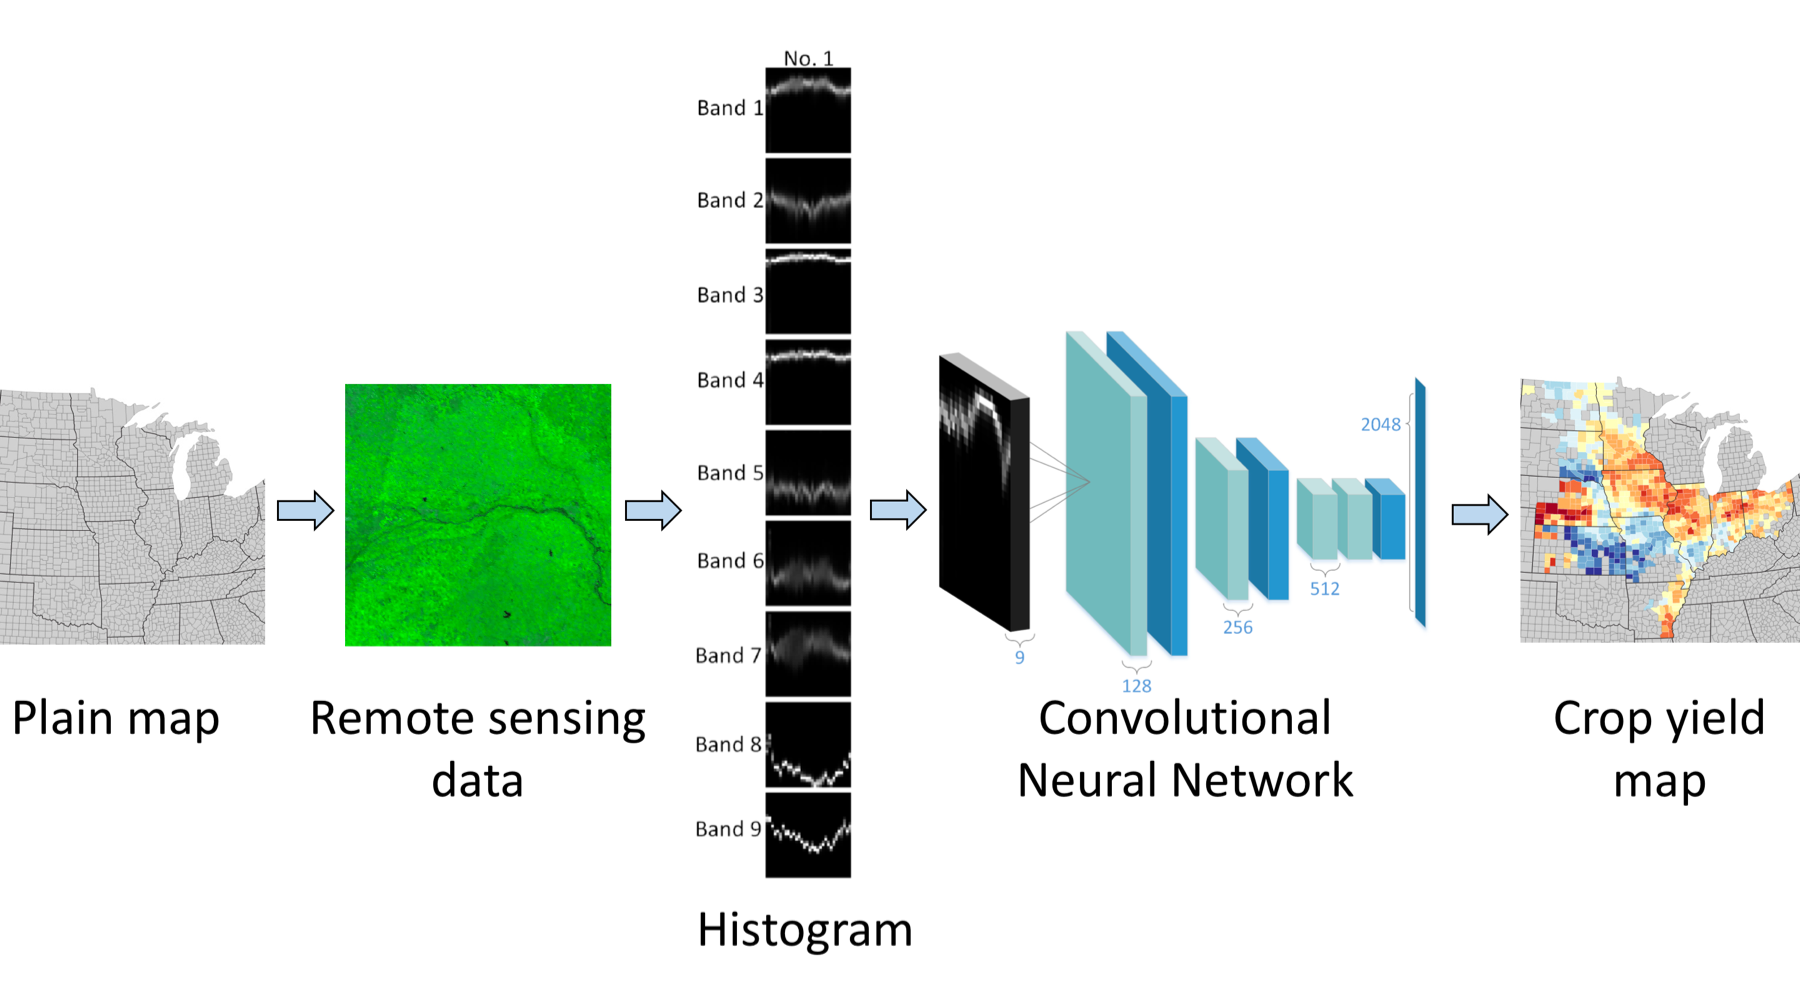
Figure 1: Basic workflow of our approach.
Visualizations of crop yield prediction results
Using remote sensing data and ground truth crop yield data in previous years, our deep learning approach can make fine predictions in a given year, and significantly outperforms competing approaches (ridge regression, decision trees and Deep Neural Network).
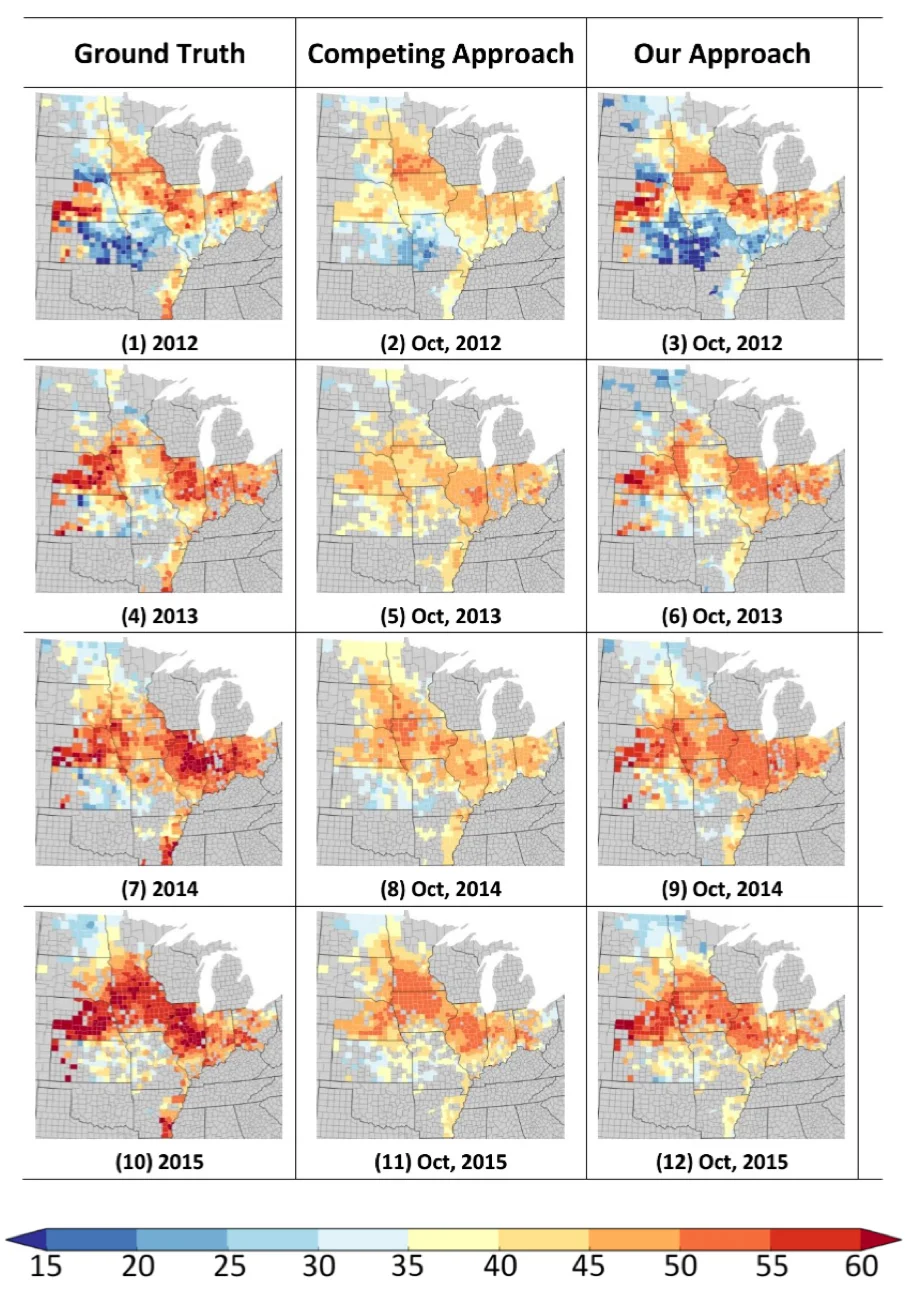
Figure 2: Soybean yield maps from 2012 to 2015, measured in bushel per acre. Predictions are made in October. Our predicted yields well match the ground-truth patterns and largely outperform the competing approaches.
Besides, if we visualize our monthly prediction in a drought year like 2012, we can see how our model gradually grasps the information about drought and makes an effective prediction, even in August, months before harvest.

Figure 3(a): Ground truth, 2012

Figure 3(b): Monthly prediction given by our model, 2012
Related links
Links to our research paper:
- Deep Gaussian Process for Crop Yield Prediction Based on Remote Sensing Data, AAAI 2017 (Best Student Paper Award in Computational Sustainability Track).
- The necessary code for the paper.
We've just won the "Best Big Data solution" award in World Bank Big Data Innovation Challenge. Here are some supporting materials:
- The announcement of the award.
- The supplementary materials, including more experiment results.
Data
If you're interested in extending our work, here are some data sources that are very helpful:
- Google Earth Engine. The remote sensing data we used were processed and downloaded from GEE Engine.
- USDA Quick Stats. The ground truth crop yield data in the United States, provided by United States Department of Agriculture. Survey data were used.
- FAOSTAT. The ground truth crop yield data across the world, provided by the United Nations
Acknowledgments
We gratefully acknowledge support from SwissRe, the Stanford Data Science Institute, NVIDIA Corporation through an NVIDIA Academic Hardware Grant, Stanford’s Global Development and Poverty Initiative, and NSF grant 1522054 through subcontract 72954-10597.


